

Discover the process.
Reconstruct activities from recorded events. Compare common routes, exceptional paths and repeated steps.
Coming soon
Process mining turns the events recorded by your systems into a clear view of how work gets done. Find bottlenecks, investigate root causes and measure the impact of changes.
01 / The idea
Process mining is the analysis of recorded business events to reconstruct how a process actually runs. It links each order, claim or other work item to the activities performed on it, their sequence and the time between recorded steps. That history shows the routes work actually takes through your organisation.
Use those routes to locate bottlenecks, investigate repeated work and examine handovers or rule breaches. Combine the findings with operational knowledge to decide what to improve, then measure the recorded process as it changes.
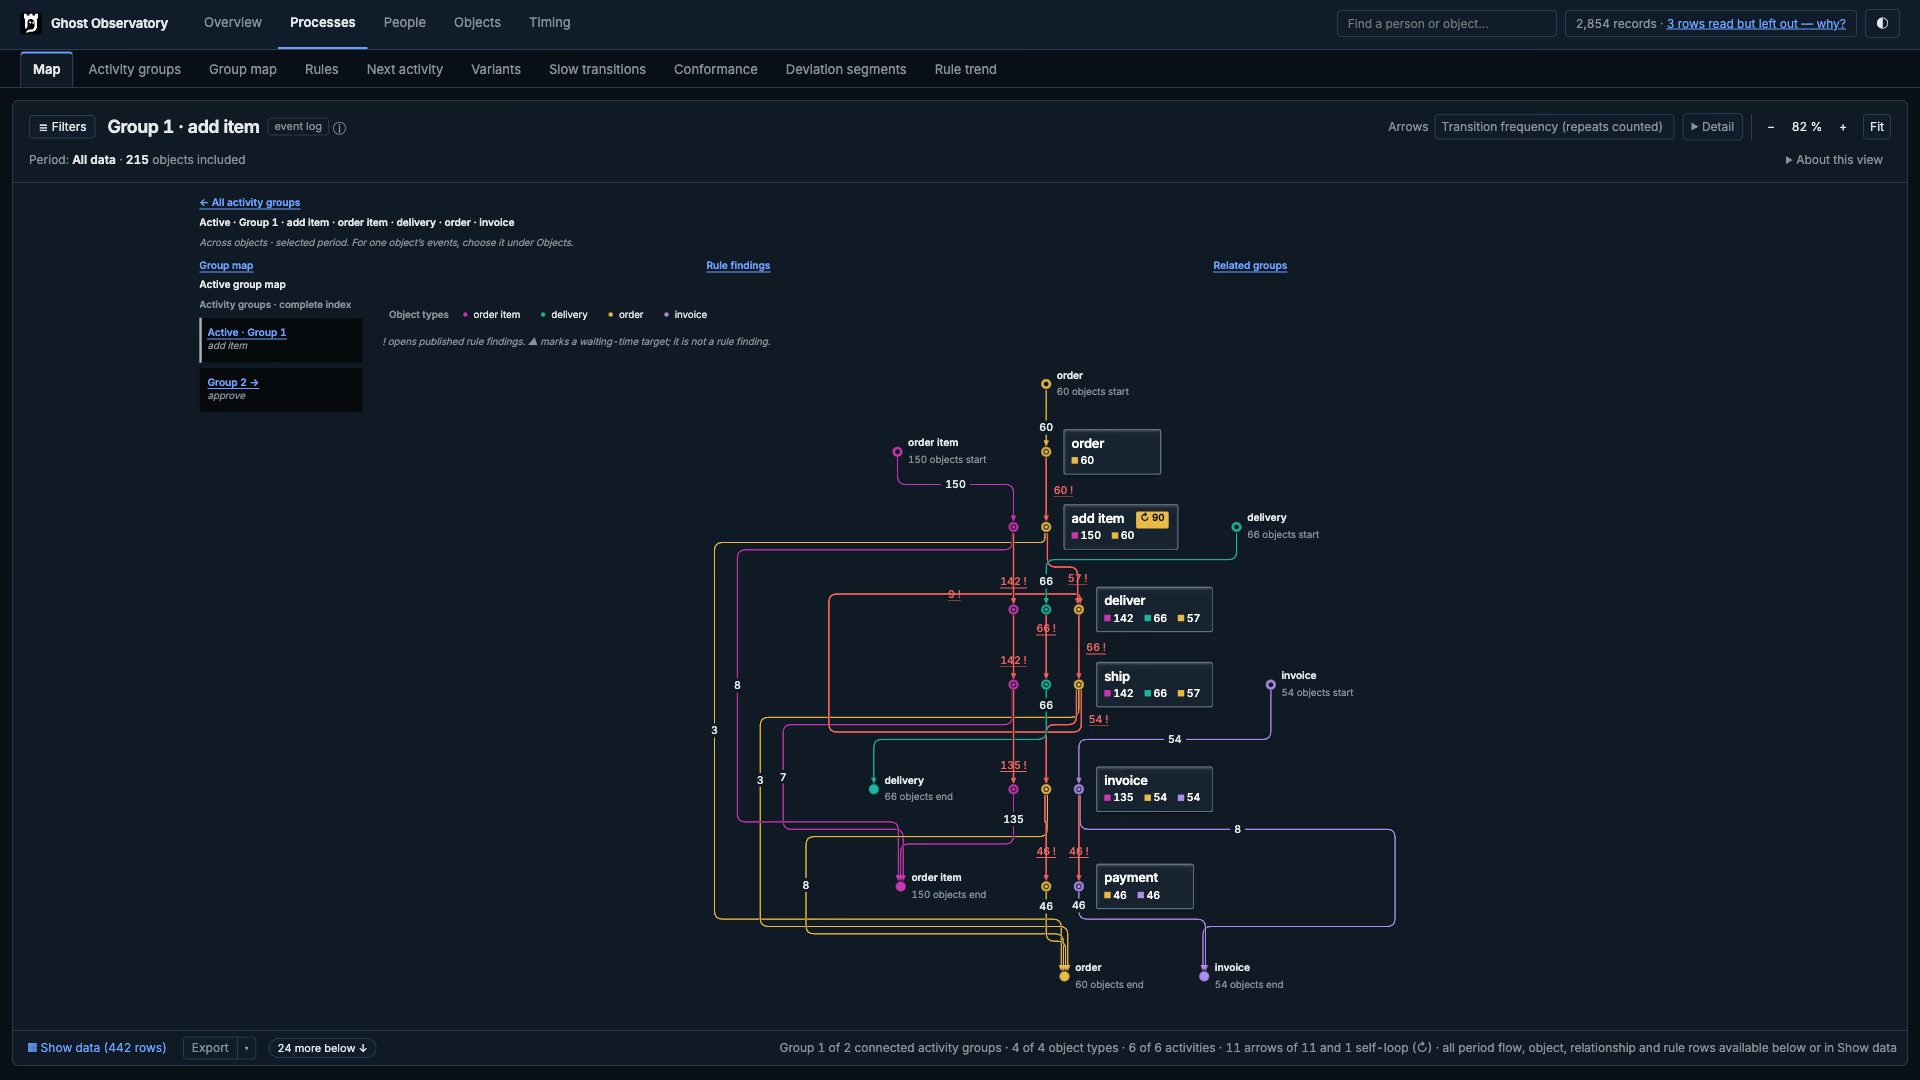
Reconstruct activities from recorded events. Compare common routes, exceptional paths and repeated steps.
Use recorded times and sequence to measure lead time, processing intervals, handovers and repeated work.
Test your operating rules against recorded actions and follow each flagged breach to the records that triggered it.
02 / The evidence
Work-item identity, activity and sequence establish the process. People, teams, calendars and rules give you more ways to understand performance.
Identity
A stable order, claim, invoice or other work-object identifier connects related events. Define exactly what that identifier represents before joining records.
Activity
Recorded steps such as Register, Inspect, Approve or Dispatch. Use consistent names and definitions so each activity has a clear meaning.
Order and time
A declared step number or sequence column establishes the route. Timestamps support timing and never replace declared order; start and end times support duration analysis. Without a declared order, the events are kept and paths are withheld.
Optional
Defined people, teams, calendars, due dates and controls support workload and compliance analysis. Missing values are reported as unavailable, preserving the difference between missing and zero.
A classic event log groups events under one process instance, often called a case. Operations also connect orders, shipments, invoices and other work objects. Analysing those relationships requires recorded links and a clear definition of what each object represents.
Start with event histories from ERP, CRM, workflow, ticketing or other systems. Ghost Observatory uses explicit YAML mappings to define the data and publishes the analysis in an auditable SQLite result.
Check required export fieldsPreparing an event log? Inspect the sample rows and preparation guide
Interactive process story / illustrative invoice
Follow one illustrative invoice through seven recorded events. Investigate waiting, handovers and fair attribution. These values teach the method; they are not Observatory results or a customer benchmark.
Invoice INV-001 / fictional records
Elapsed time / recorded evidence
Day 1: the invoice is received. No elapsed-time conclusion yet.
The Day 2–6 interval contains no intervening event in this illustrative history. It does not establish that no work occurred, why the invoice waited, or anyone's working time.
Day 1: the invoice is received. This is the first recorded event in the illustrative history.
The longest illustrated gap lies between the Day 2 handover and the Day 6 queue observation. It is elapsed time, not a proven cause or labour duration.
Illustrative records only. WebGPU adds animated connections; all events and explanations remain available without it.
03 / See the proof
Our published synthetic claims example contains 300 claims and 7,402 recorded events. The rule asks whether the same person assessed and approved the same claim.
Inspect the source-linked worked example04 / Interpreting results
Reliable process intelligence makes the basis of each conclusion clear: the events recorded, the time measured and the sources used.
An absent event leaves an unanswered question. Check whether the activity was unrecorded before concluding that it was skipped.
A claim waiting overnight has an elapsed interval. Labour time requires separate evidence of the work performed.
Use queues and repeated work to focus the investigation. Establish the cause with operational context, then combine measured time with cost data to build the business case.
Specify which system supplies identity, sequence and duration when sources disagree. Those decisions keep the analysis consistent and traceable.
For the foundations of the field, see the Process Mining Manifesto (IEEE Task Force on Process Mining).
Explore the Reader captures, the sample data and the complete data requirements.
Explore six Reader viewsUse the event-log guide to prepare the evidence. Then choose between following a process path and calculating time: the two require different fields.